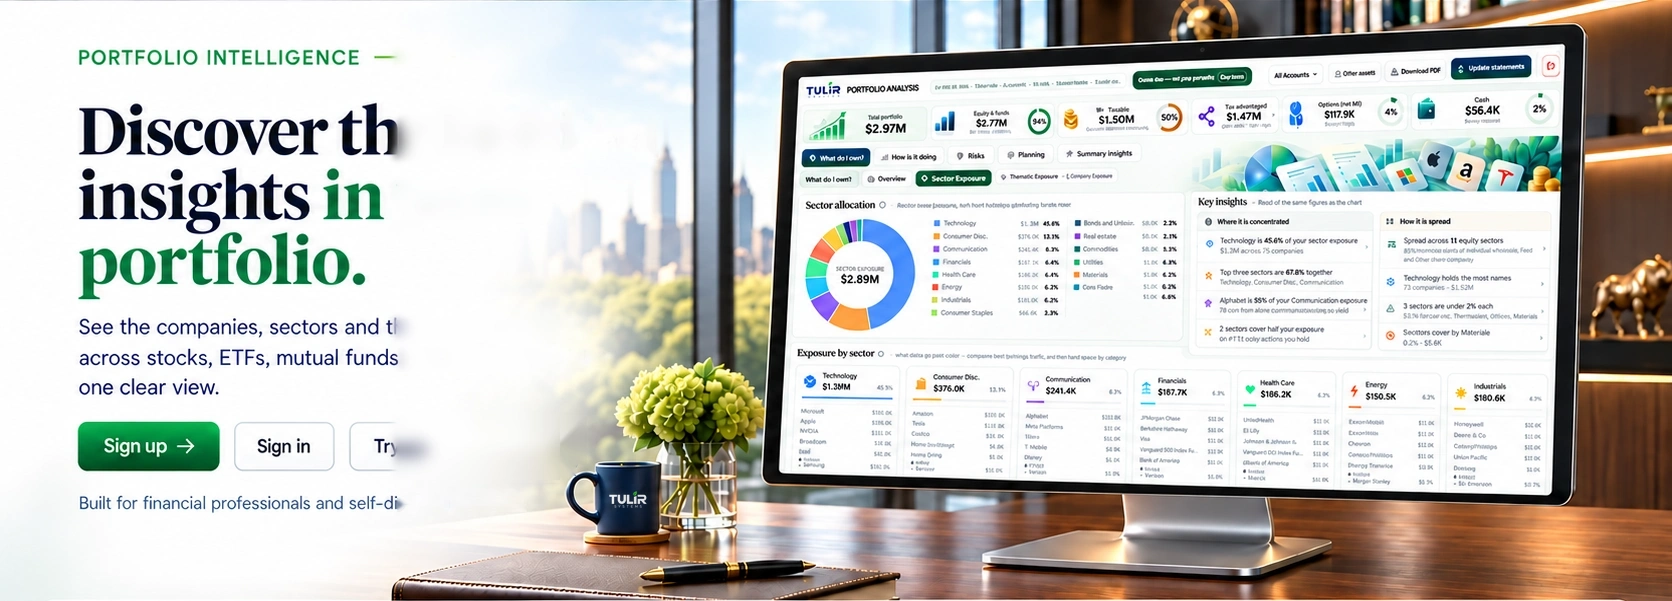
Built for financial professionals and self-directed investors. Advisers can manage their clients under one login.
Consolidate
See through all your accounts, funds and investment structures. Drop several statements in together and read them as one portfolio.
Look Through
Uncover your true company-level exposure: the same company, held directly and inside funds, added up in one place.
Understand
Know what’s driving your portfolio and where you’re concentrated, with fund overlap and sector weights laid out.
Make Informed Decisions
Turn deeper portfolio understanding into thoughtful choices, with stress tests, tax and retirement models to explore.
25Analyses from a single upload, from concentration to retirement withdrawals
14Preset stress scenarios, plus one you build yourself
1,000Simulated market paths behind the portfolio and retirement Monte Carlo
51State tax jurisdictions modelled, not just your own
What it does
One upload. Twenty-five answers.
Most tools show you what you hold. This one is organised around the questions you actually ask about it — grouped much as the app itself is.
01 / 06
What do I own
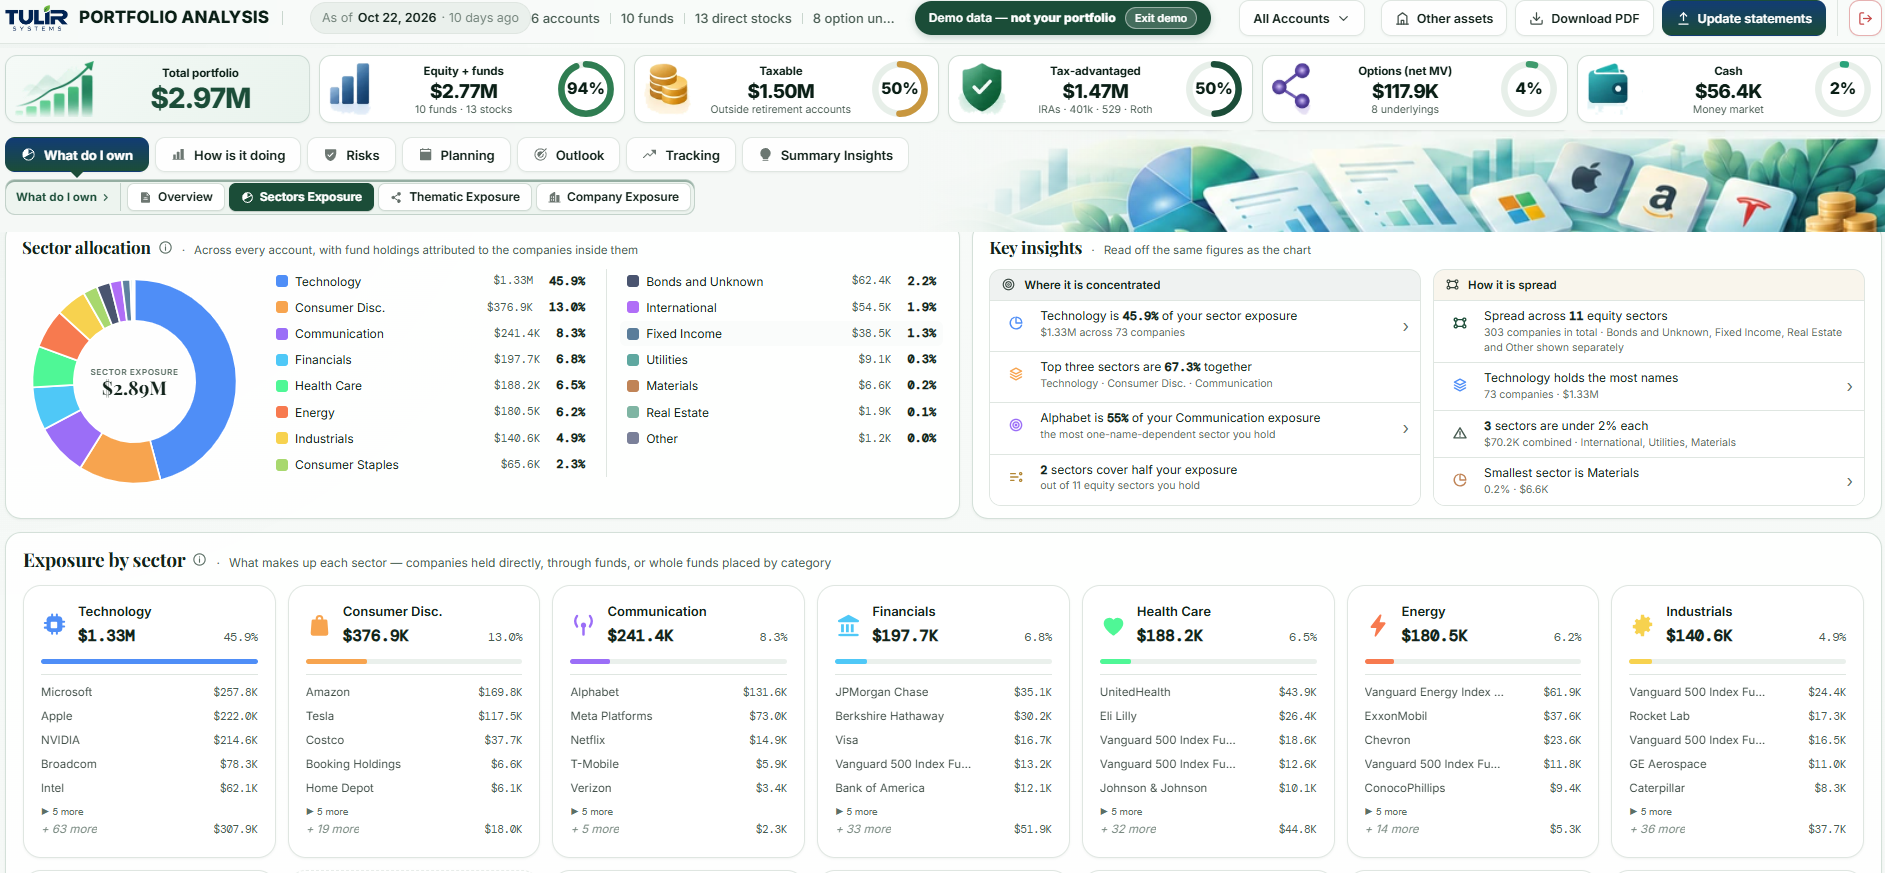
Look-through resolves the holdings inside your ETFs and mutual funds, then adds each company up across every account — direct shares and fund slices together. Coverage is the funds’ larger positions, and a fund that cannot be resolved stays whole rather than guessed at. Same view by sector and by theme.
Position-level gain and loss across accounts, estimated dividend income and yield, the annual dollar cost of your expense ratios, and a Fundamental Score that ranks each holding against peers in its own size-and-style cell rather than the whole market.
LedgerPerformanceRatingsIncomeFee Drag
03 / 06
Risks
Concentration thresholds, the companies your funds quietly hold in common, a correlation heatmap built from the names that actually carry weight in your portfolio, and fifteen stress scenarios — of which the four company-shock ones can also propagate the shock through the correlation matrix.
ThresholdsOverlapCorrelationStress Test
04 / 06
Planning
Drift against the targets you set, harvestable losses in taxable accounts with wash-sale windows flagged, bracket-fill Roth conversion ladders, withdrawal sequencing through retirement, and what a purchase would do to your mix before you make it.
A thousand simulated market paths run against your actual holdings so you see a range instead of one line, the contribution rate a dollar target would require, and long-horizon projection at a growth rate you control.
Monte CarloGoal CalcProjection
06 / 06
Tracking
Reads the option rows in a Fidelity export and pairs them into spreads: structure, contracts, days to expiry, cost basis, current value, profit and loss and breakeven per position, with any leg it could not pair listed on its own. Option delta also feeds the stress scenarios.
OptionsFidelity format
All twenty-five come with a plan. An account needs your name, an email address, a password, the role that describes you and your acceptance of the terms; see what it costs. Sign up and Overview and Sectors Exposure open on your own statement.
Correlation cascade
The ripple most tools leave out
When NVIDIA falls 40%, Broadcom and AMD do not sit still. The stress test propagates the shock through a 30×30 correlation matrix at a 65% transmission factor, so the number you see includes the second-order damage — not just the position you shocked. Turn the cascade on and compare the two.
30×30 correlation matrix65% transmission factor4 company-shock cascade scenariosOption delta included
Which account you draw from first compounds for thirty years. The retirement planner simulates your portfolio through retirement year by year — enforcing RMDs as a floor, applying the early-withdrawal penalty where it applies, and settling tax annually — then shows two withdrawal strategies side by side, including whether each one lasts and a longevity stress test ten years past life expectancy.
Fill bracketLasts through life expectancy$412K lifetime tax
Fixed orderTaxable, then pre-tax, then Roth. Runs out at age 89$487K lifetime tax
Illustrative planning model · Not a forecast
How it works
Three steps. Zero setup.
01
Export, or use your statement
Download your positions as CSV from Fidelity or Schwab — or use a monthly PDF statement, the kind you download rather than a scan. Fidelity, Schwab, Vanguard, Robinhood and Morgan Stanley are read directly, and other brokerages are read too, so long as the figures add up to the totals printed on the statement. Accounts at more than one, or several files to combine? Drop them in together.
02
Drop the file in
A PDF statement is imported only when its figures add up to the totals printed on it; a CSV export is read as exported, without that check. If you would rather not use your own numbers yet, the demo portfolio loads with one click.
03
See what your funds really own
A plan opens all twenty-five: company exposure, risk, planning, retirement, outlook and the summary that pulls them together. What it costs.
Get started
Ready to see what you really own?
A plan opens all twenty-five analyses on your own portfolio — see pricing. Sign up and Overview and Sectors Exposure open on your own statement. The demo shows What do I own in full — Overview, Sectors Exposure, Thematic Exposure and Company Exposure — plus Reallocation, to anyone.