Everything it does

What you actually get for $4.99 a month.

Twenty-five tabs of analysis from one brokerage statement, grouped here much as they are grouped in the app. Where a figure rests on a reference table, the size of that table is stated beside it.

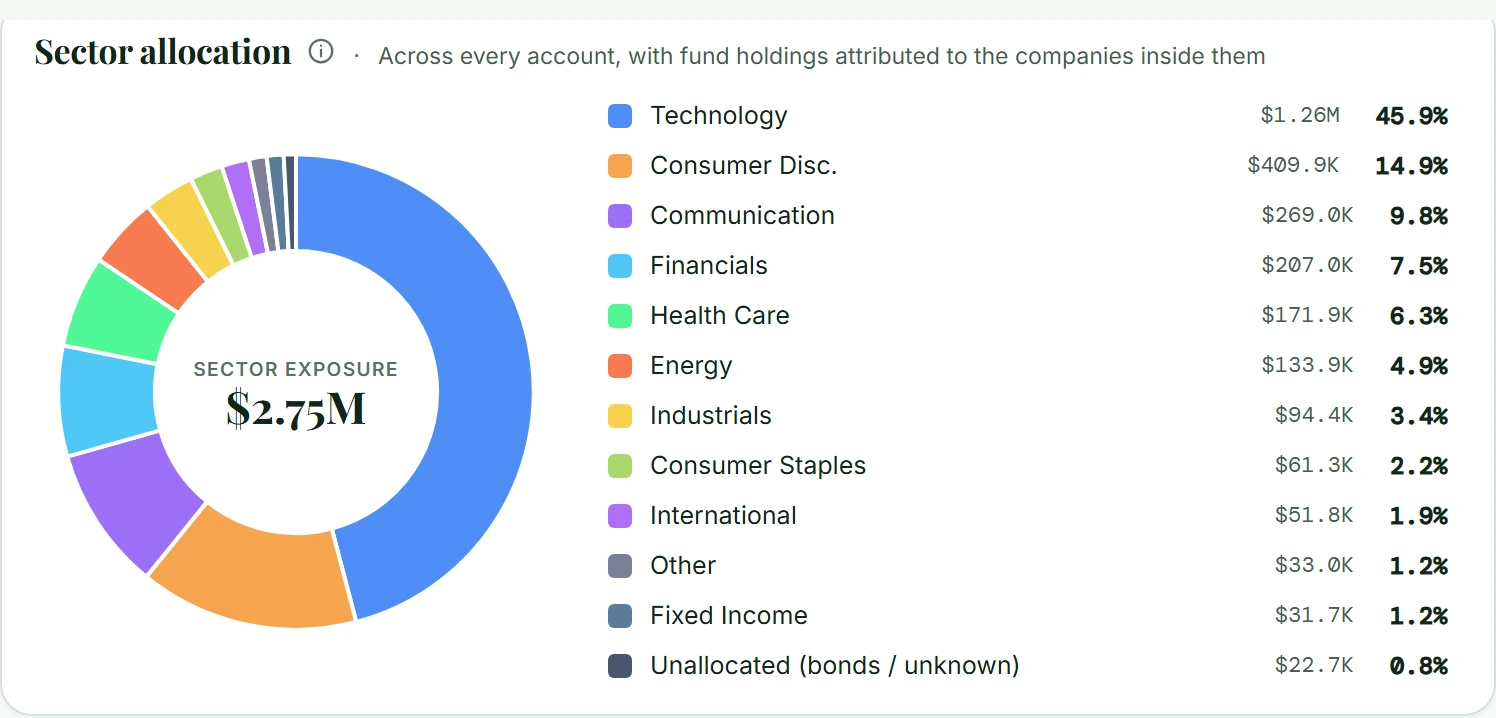
The Sectors Exposure tab: a ring of sector weights built across
          every account, with fund holdings attributed to the companies inside
          them, and a legend listing each sector with its dollar value and
          percentage, including an unallocated slice.
The real app, on the demo portfolio that opens without an account.
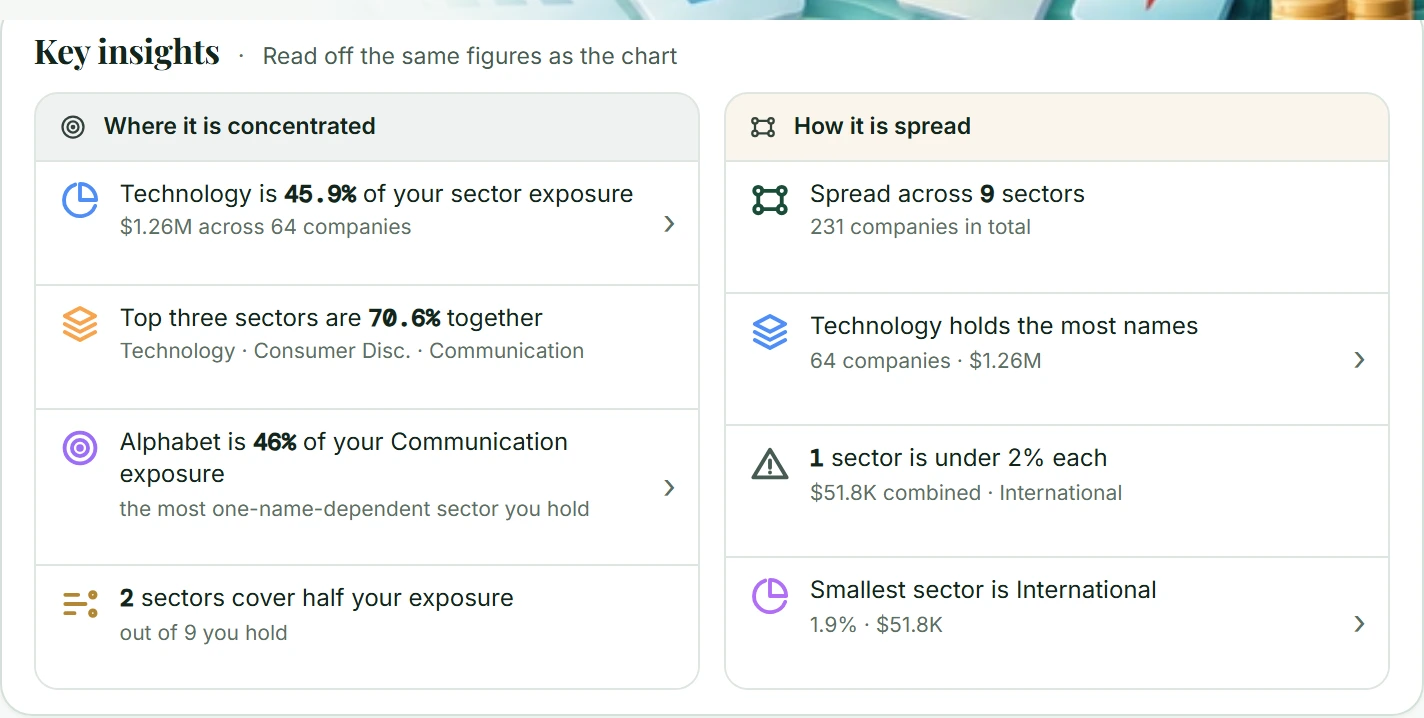
The Key insights panel beside the ring, reading the same figures
          back in sentences: where the portfolio is concentrated, and how widely
          it is spread.
The same figures, read back in sentences.
What makes it different

Six questions. One complete picture.

Start with the questions that matter. The exact figures, and the limits of each one, are a click away underneath.

01 / Ownership

What am I really invested in?

Your holdings consolidated across accounts, then opened up: the companies inside each fund, the sectors and themes they add up to, and the exposure you hold without ever having bought it directly.

See what it includes
02 / Risk

Where is my portfolio vulnerable?

Seven one-click shocks and seven macro sliders, your own concentration limits, how much your funds duplicate each other, and how your largest names tend to move together.

See what it includes
03 / Planning

How might my future unfold?

Retirement year by year with federal and state tax, a thousand simulated market histories, college costs per child, and the spending plan behind all of it.

See what it includes
04 / Performance & cost

What is performance costing me?

Trailing returns against six benchmarks, dividend income and yield, and what your funds take in fees each year — in dollars, with cheaper equivalents named where they exist.

See what it includes
05 / Tax decisions

What trade-offs deserve a closer look?

Roth conversion to a bracket you choose, losses worth harvesting, shares worth giving rather than selling, and what a purchase would do to your mix before you make it.

See what it includes
06 / Clarity & reporting

Can I explain what I found?

A written summary drawn from the same figures as the tabs, and a PDF that carries each section’s own caveats rather than leaving them behind on the screen.

See what it includes
Try before you decide

See real analysis before you create an account.

Open the demo portfolio with no account, or sign up to use your own statement. Five of the twenty-five tabs stay open on the demo without signing up, and they are the ones that answer “what am I actually holding”.

Capability No accountdemo portfolio Full planafter beta
Overview, Sectors Exposure, Company Exposure and Themes✓✓
Reallocation — your mix against a target✓✓
Ledger, Performance, Ratings, Income and Fee Drag—✓
Stress Test, Thresholds, Overlap and Correlation—✓
Retirement, College, Roth, Tax-Loss, Donate, Pre-Buy—✓
Monte Carlo, Goal Calc and Projection—✓
Options tracking, Summary Insights, the PDF and saved plans—✓

Some tools need figures from you — a retirement plan cannot project without an age and a spending number. Coverage and limits are stated inside each tool, on screen.

For people who want the detail

Explore the complete toolkit.

Twenty-five tabs of analysis from one statement file, grouped here much as they are grouped in the app — so what convinces you now is where you will find it afterwards.

Where the limits are, they are in the text. Coverage, the size of a reference table, and what a tool needs from you are stated beside the claim rather than collected in small print.

What do I own? Overview · Sectors Exposure · Thematic Exposure · Company Exposure
  • Your funds opened up. A company you hold through six different funds appears once, with the total you actually own of it. Company-level holdings ship for 48 funds and ETFs — 37 with a list of their own and 11 mapped onto one of those as an equivalent or a proxy; how much of a fund they reach varies, and the part they cannot reach is shown separately rather than quietly dropped.
  • One row per company: shares held directly, the share owned inside funds, the net value of any options on it, and which of your funds carry it.
  • Funds we do not recognise are looked up. The app reads the fund’s most recent public SEC filing in the background. It needs a connection, and the result is refused unless at least 60% of the filing resolves to an identified security — a fund it cannot resolve stays listed as not looked through.
  • A sector ring built from the companies underneath where a fund’s holdings are known, and from the fund’s own published category mix where they are not, each labelled so you can tell which is which. What can be placed neither way gets its own Unallocated slice.
  • Fixed income split by what it actually is — government, investment grade, high yield, securitized, municipal, emerging-market debt, bank loans, private credit and cash — for 13 recognised bond funds, with the share priced and the age of the oldest factsheet behind it.
  • Six growth themes, with the overlap between them made explicit and the total counted once rather than summed twice.
  • Hold any set of accounts up to the light. Tick the accounts you want and every figure rebuilds from those rows alone. Retirement, Trust and Crypto group automatically, plus up to 20 groups of your own.
  • Account types read from their labels — Roth, 401(k), 529, trust — and correctable by hand when a label is ambiguous.
  • Teach it a fund it does not know by entering the top holdings yourself, and the whole analysis re-runs.
How is it doing? Ledger · Performance · Ratings · Income · Fee Drag
  • A ledger line for every holding: shares, price, value, cost basis, gain and loss, and which accounts hold it. The totals state how many positions carry a cost basis and what is excluded, rather than implying they cover everything.
  • Trailing returns over 1, 3, 5, 10 and 15 years, computed on our own server from dividend-adjusted month-end closes and re-priced monthly. A window is left blank where no source covers that symbol for that period, and a dagger marks any return taken from the built-in reference table instead.
  • Your portfolio beside six benchmarks — S&P 500, Nasdaq 100, total US market, small caps, international and US bonds. The portfolio row prints its own coverage and dashes any column where under half the value is priced.
  • YTD and distance from the 52-week high, from a daily price refresh on our server, there when the portfolio loads — as of the last refresh, not live quotes.
  • Estimated dividend income, yearly and monthly, with the portfolio’s weighted-average yield. Fund yields are built by looking through to what the fund holds, with the coverage shown on each row.
  • What your funds cost you in a year, in dollars rather than basis points, plus a ten-year compounded figure at a growth rate you set. 52 funds are priced; any fund outside that set is named and left out of the total rather than counted as free.
  • Thirteen funds are compared with a cheaper equivalent, each with the yearly and ten-year difference in dollars — presented as a cost comparison, with the capital-gains consequence of switching stated beside it. An individual sees the cheaper fund named; for an adviser, where the household already holds a cheaper fund on the same index, that is the fund named. None of it is a recommendation to switch.
  • A Fundamental Score out of 100 per holding, from three equally weighted components — valuation, profitability and risk — scored against one of nine size-and-style peer cells rather than the whole market. Read from a built-in table when the tab opens; the style map covers 371 companies and the headline score says what share of your value it covers.
Risks Stress Test · Thresholds · Overlap · Correlation
  • Seven one-click shocks — a sector down 30%, NVIDIA down 40%, mega-cap tech, cybersecurity and semiconductors, and the whole portfolio down 15% and 35% — each showing the dollar impact position by position, ranked.
  • Seven macro sliders: rates, oil, the dollar, gold, CPI, PPI and GDP, each moving nine sectors differently, with 43 click-to-jump reference levels across six of them — 2008 oil at $147, 2022 CPI at 9.1%.
  • A shock reaches the funds that hold the name, not just your direct shares, so a hit to NVIDIA is felt in the S&P 500 fund that holds it. Only for funds whose holdings are known or that you have taught it, and only their named holdings are shocked.
  • Options are shocked too, at an estimated delta per underlying, where the statement holds them. On the single-name and basket scenarios you can also switch on a correlation cascade, which moves related names at a damped fraction and ignores weak pairs.
  • Build your own: ten sector sliders, plus or minus sixty percent.
  • Your own concentration limits — one company, the top three, one sector — reported at two levels, a warning and then an alert. A company over the line is broken into direct shares, exposure through funds and net option value, so you can see where it came from.
  • How much your funds duplicate each other, as a pairwise grid covering 27 funds and 351 pairs, with your highest-overlap pairs called out and the biggest names they share named.
  • A correlation heatmap of your largest names, with five preset views beside your own and a plain-English reading of each pair. On your own view, where a year of daily returns is held for at least two of those names, each pair is measured from them, and a pair with fewer than 60 shared trading days shows a dash; otherwise, and on the presets, it uses a 30-name reference table of published estimates. It says which of the two you are looking at, and how many of your largest names it could not cover.
Planning Reallocation · Tax-Loss Harvest · Roth Conversion · Pre-Buy Impact · Donate · Retirement · College
  • Retirement projected year by year, with federal tax and all 51 state jurisdictions, from opening balances taken off your statement rather than retyped. A 13-column table per retired year: age, the withdrawal, which bucket it came from, ordinary tax, capital gains tax, early-withdrawal penalty, state tax and the closing balances.
  • Two withdrawal orders compared side by side — lifetime tax, tax by decade, and what is left at the end.
  • A thousand randomised return paths, charted as percentile bands by age, with the share in which the money never runs out — and a verdict that also tests living ten years longer.
  • Required distributions at 73 or 75, capital gains stacked on ordinary income across the 0%, 15% and 20% bands, and couples run as two lives with the survivor’s years filing single.
  • A 25-line budget worksheet in seven categories feeding the spending figure, with step-ups, step-downs and one-off costs at ages you choose.
  • College, per child: four cost tiers priced side by side, what your share comes to, what is short, and the monthly saving that would close it. It flags the years two children overlap and lists the accounts it read as 529s for you to assign.
  • Roth conversion up to a bracket you pick, this year or as a multi-year ladder — including whether your taxable cash covers the tax bill, and what it does to your first required distribution.
  • Tax-loss candidates, in taxable accounts only, each with the loss and the account it sits in, and a flag where the same position is also held in an IRA. 50 widely held symbols carry one example of something similar to hold through the 31-day window, offered as examples rather than endorsements.
  • Appreciated-stock donation candidates ranked by tax efficiency, with a plan you can edit.
  • Reallocation — your weights against a target — six risk presets, six reference allocations or your own — with the dollar gap on each, and a staged plan that uses tax-advantaged accounts and new cash before anything that realises a gain.
  • Pre-Buy Impact: type a ticker and an amount and see the sector and company shifts, the income it would add, and how much of that fund you already own indirectly.
Outlook & Tracking Monte Carlo · Goal Calc · Projection · Options
  • A thousand simulated market histories for what you hold, stepped monthly, out to a horizon you choose, charted as percentile bands. Cash and option positions are not projected.
  • Where your outcomes approach the federal estate exemption, the chart draws it as a rising indexed line — one person and the doubled figure for a couple — and says what share of the runs land above it. On a stated $15M-a-person 2026 assumption, indexed at your inflation rate. Federal only; state estate taxes are not modelled.
  • Goal Calc works backwards from a target. Enter an amount and a year and it shows what each of the three levers — return, saving and time — would have to do on its own, reusing your portfolio’s own return and volatility.
  • Projection compounds what you hold forward, at your portfolio’s own weighted historical rate or a rate you set, with optional monthly contributions and milestones along the way. It states the share of your portfolio it could price, and says so plainly when it can price none of it.
  • Option legs paired back into the spreads you actually opened, with net cost, current value, profit and loss and the return multiple. Cost basis comes from the broker’s own figures. Max value at expiry and breakeven are shown for two-leg debit verticals; anything that could not be paired with confidence shows a dash rather than a made-up number.
What you take away Summary Insights · PDF · Your account
  • A written summary of the report in plain sentences, drawn from the same figures as the tabs rather than computed separately.
  • A PDF of the whole thing, with a cover page and the sections you choose. Every printed section is headed “Informational analysis — not investment advice”, each carries its own caveat, and the report closes with a full disclosure page.
  • Your plans come back. The retirement plan, the college plan, your other assets and your account corrections are saved to your account and are there on another device.
  • Your statement file is not uploaded. It is read in your browser; what is stored is the parsed holdings. The privacy policy sets out what is kept and how to delete it.
Purpose-built for client work

One analyst’s toolkit. Every household in your book.

Each client gets the same depth of analysis, kept apart from the others, under a single adviser login — with no charge per household. At fifty households, a $1,188 seat works out at $23.76 of seat cost per household a year. That is arithmetic on the seat fee, not a per-client rate.

  • 01Up to 500 active client households per seat
  • 02Each client’s holdings, plans and corrections kept separate
  • 03A report and a PDF per client, named on the cover
  • 04One seat per adviser login; several can be invoiced together
Ask about advisory access
Client portfoliosAdviser workspace
Household AOwn portfolio and saved plans
View report
Household BOwn allocation, risks and plans
View report
Household CIndependent client analysis
View report

Illustration of the client switcher — not a product screenshot.

How your data is treated

Three things worth being precise about.

01

Your statement file stays local

The brokerage file is read in your browser and is not uploaded. Nobody here receives the document you exported.

02

Parsed holdings are stored

The positions and their values are kept under your email address so the report is there when you come back, along with your saved plans. The privacy policy sets out the rest, including what an administrator can open and what that records.

03

Coverage is shown, not assumed

A fund it cannot look through, a return window with no source, a position with no cost basis — each is reported as missing rather than counted as zero or as full coverage.

If a plan lapses, what you have stored is not deleted. The analysis pauses and comes back when the plan does.

Common questions

Answers before you start.

Is it free during beta?

Accounts opened now are not being charged. The prices on this page are what it will cost when beta ends, and you will get an email before anything changes on your account. There is no end date announced, and no promise that a beta account stays free afterwards.

What can I use without creating an account?

Five of the twenty-five tabs: Overview, Sectors Exposure, Thematic Exposure, Company Exposure and Reallocation — on the demo portfolio. Those are the ones that answer “what am I actually holding”.

Reading your own statement needs an account, and opens Overview and Sectors Exposure on it. Everything else — the ledger and returns, income and fees, the risk tabs, all the planning work, the outlook projections, options tracking, the written summary and the PDF — needs a plan.

Does $4.99 a month cover my spouse or partner?

Yes. A couple is one household, and the retirement planner models two lives, including what changes for the survivor.

How is an advisory seat billed?

A seat is one login with its own client book, at $99 a month, billed $1,188 a year. There is no charge per client, so a seat carrying forty households costs the same as one carrying four. A seat holds up to 500 active client households; archived clients do not count toward that, and if you need more, write to us.

A seat is not a firm-wide login. Four advisers who each want their own book is four seats, and they can be invoiced together.

Is my brokerage statement uploaded?

No. The file is read in your browser. What is stored is the parsed holdings — the positions it read, with their values, cost basis and account labels — under your email address, so your report and plans are there on another device. Each time a portfolio is opened, the app also sends the ticker symbols it found to our server on its own, without quantities or values, so they can be classified and priced; the server keeps a list of those symbols with no account attached. A fund it does not recognise is looked up from public SEC filings, and the description printed beside it is sent too, with dollar amounts and long digit strings removed. The privacy policy sets out each case.

Can I pay online today?

No. There is no card form and no checkout. To start a plan, or ask about several seats, email hello@tulir.systems and we will confirm the price in writing first.

Does it tell me what to buy or sell?

No, and it is not built to. It shows what you hold, what it is exposed to, what it costs and how it behaves under assumptions you can see and change. Nothing in it is a recommendation to buy, sell or hold any security, and it is not investment, tax or legal advice.

There is more in there than a statement shows.

Open the demo and look, then sign up to bring in your own export. The demo needs no account, and nothing is charged during beta.